Analyze your operation. Find opportunities. Capitalize on the results.
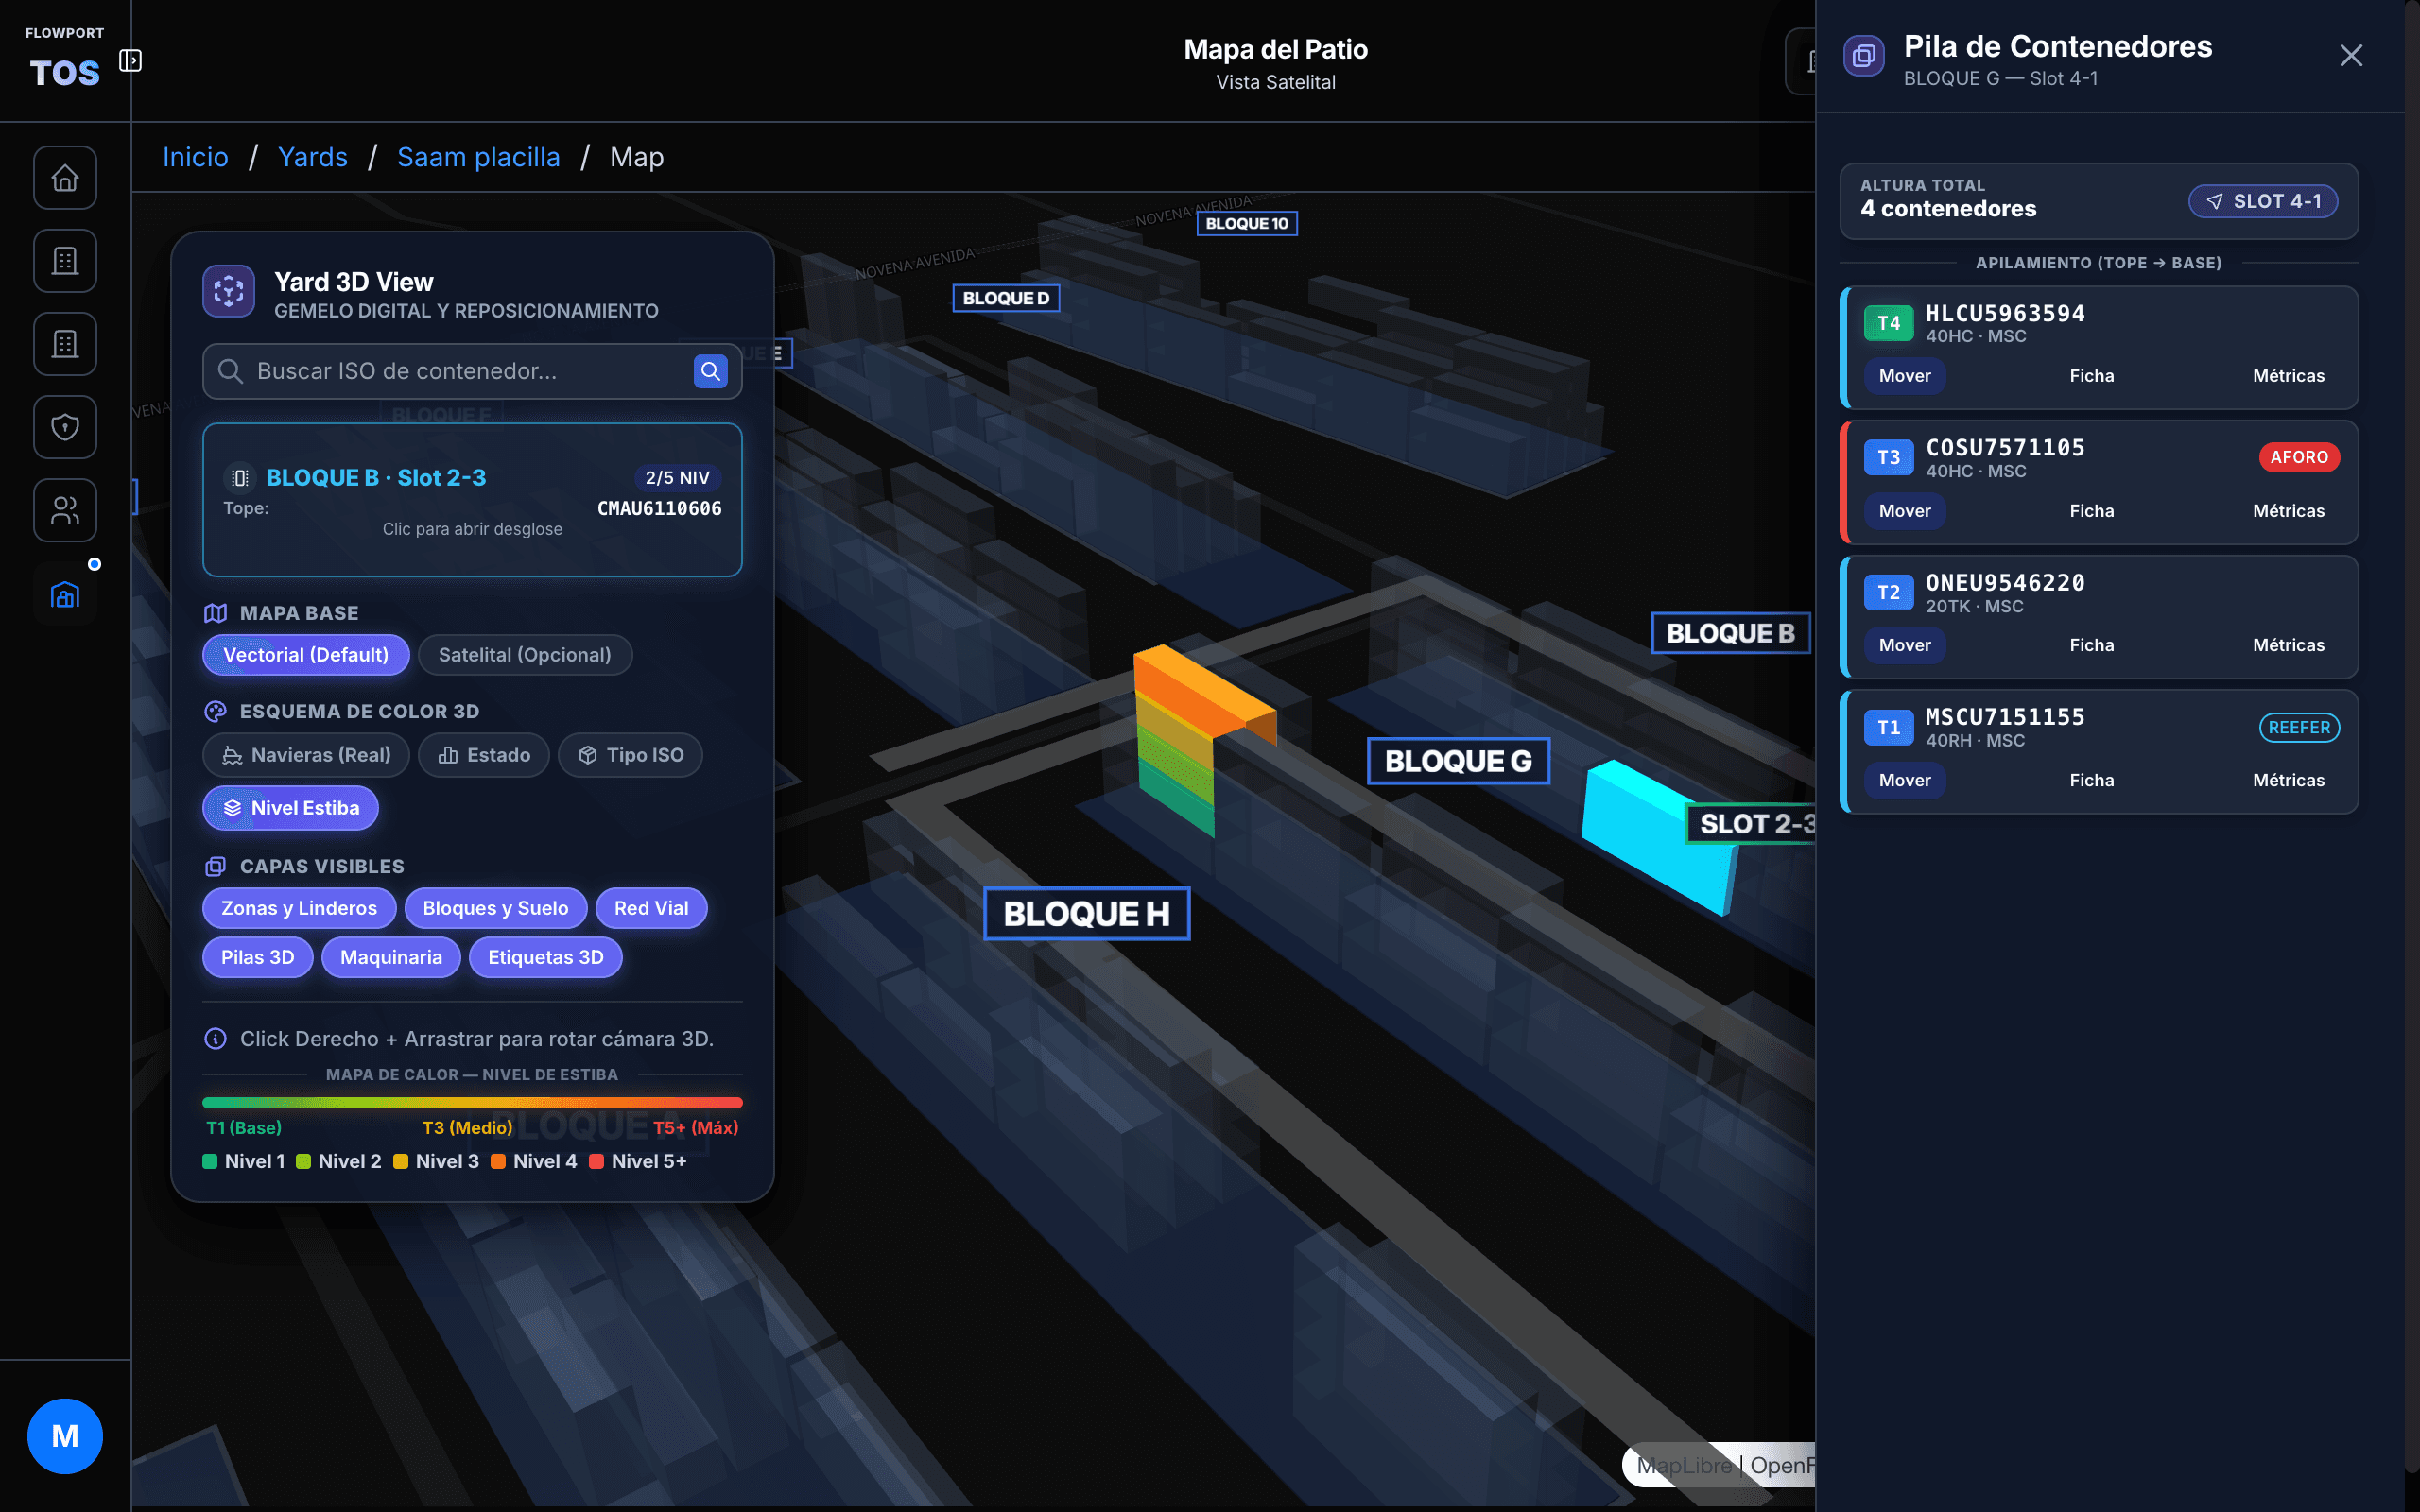
FlowPort turns your operation's data into a digital representation of your yard so you can visualize, analyze and simulate different operational scenarios.
It combines a 3D digital twin, What-If simulation and optimization algorithms to uncover productivity, capacity and equipment-utilization opportunities.
First we measure. Then we optimize.
Technology built in Chile with regional reach
FlowPort helps logistics operators compete globally by optimizing the efficiency of the entire yard and port-terminal ecosystem through 3D digital twins and predictive analytics.
Project co-financed by



From multivariable uncertainty to the perfect yard plan
FlowPort ingests dynamic external and internal signals from the port yard, resolving operational conflicts in milliseconds through combinatorial optimization.
How much value could your operation recover?
Moving containers unnecessarily burns fuel, wears machinery and cuts margin. Pick your operation profile or customize the data to estimate its improvement potential.
* Values in USD. Preliminary estimate over 312 operating days (26 days/month) with an optimization scenario of 32% reshuffle reduction (fuel, operator and crane wear). It does not constitute a guarantee of results.
Current estimated annual loss
Potential annual savings
~$3,744 USD / month of potential savings
-32%
Movement reduction potential
~9,360
Unproductive moves identified / year
What does this mean for your operation?
This calculation is an estimate based on the inputs. An operational assessment validates the potential with real data and builds a specific business case.
Field work
Gallery of on-site work for technical validation.
 01
01 02
02 03
03 04
04 05
05 06
06 07
07 08
08 09
09Software engineering and data science applied to logistics
A multidisciplinary team and AI specialists building the digital infrastructure to optimize your operations.



Four tools on a single spatial engine
Modular architecture to optimize inventory, model contingencies and reduce unproductive moves.
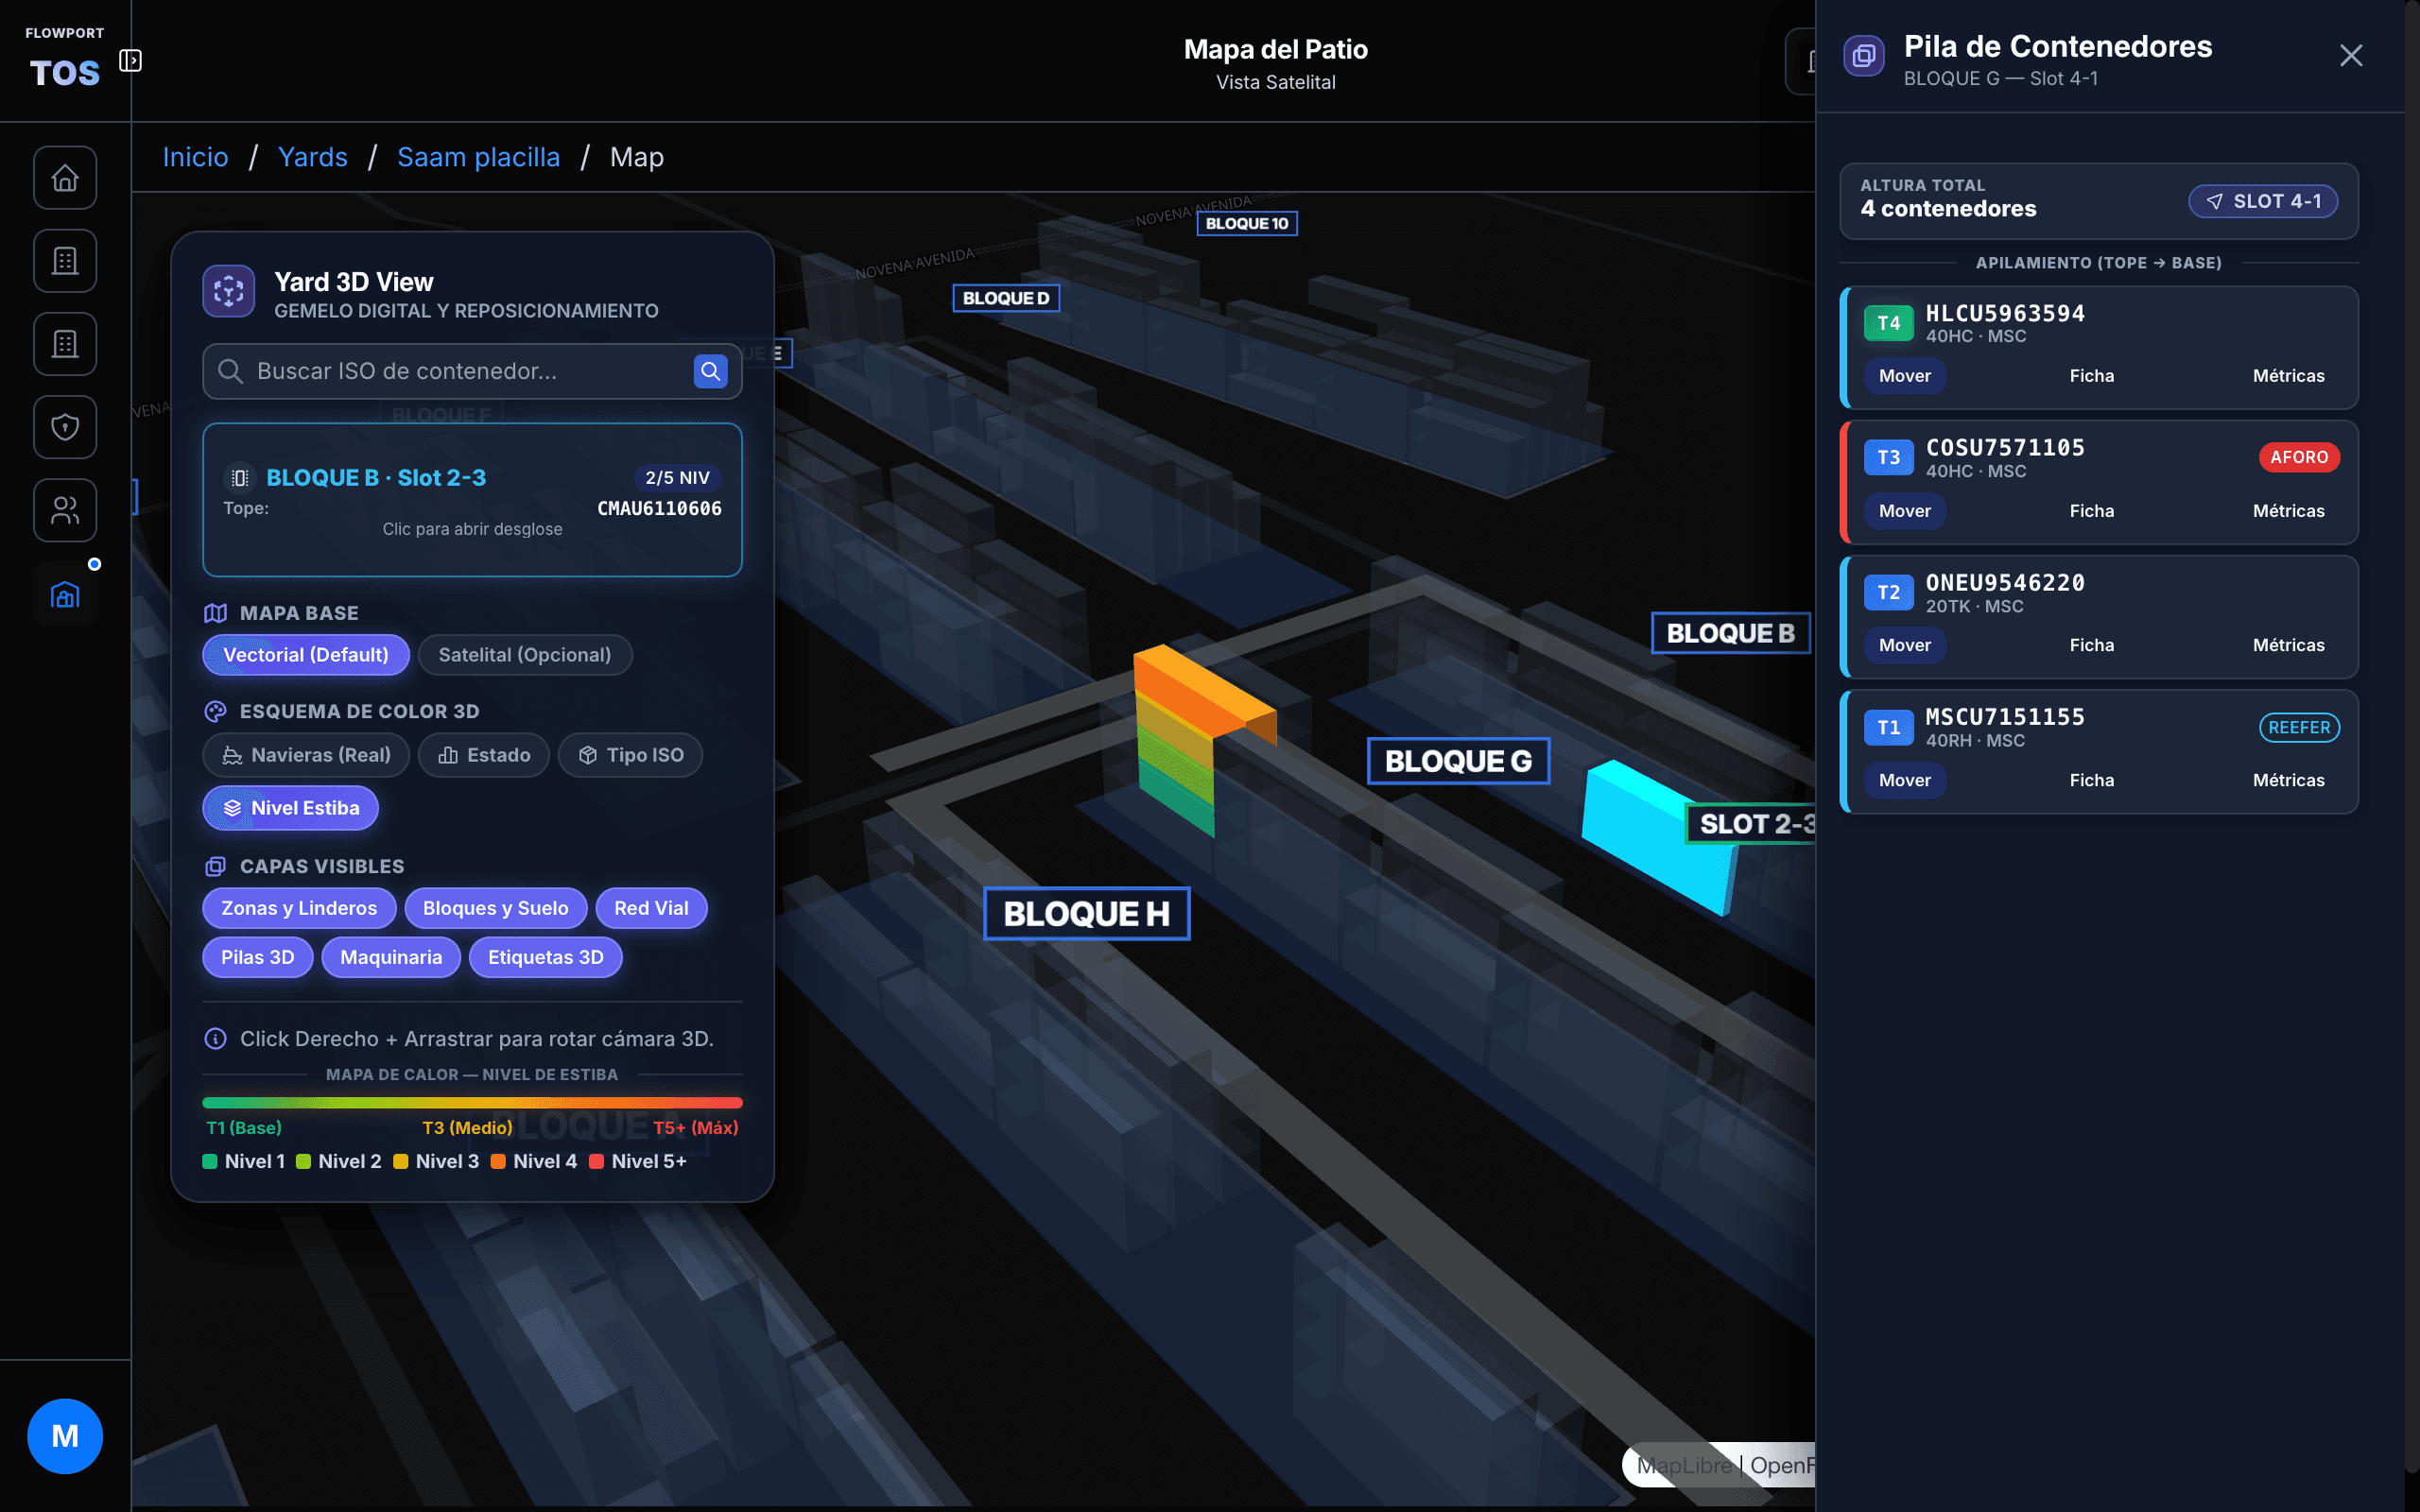
Complete spatial visibility and traceability of every container in 3D.
3D digital twin of the port yard. Every container is georeferenced with its ISO code, carrier, weight, height, type (Dry, Reefer, IMO) and dwell time. Locate any unit in under 15 seconds from a PC or in-cab tablets.
< 15 sec
Search Time
100%
Spatial Traceability
3D
Orbital & Isometric Twin
Additional capabilities for high-throughput terminals and depots
Why FlowPort beats manual spreadsheets
Modern architecture designed to deploy fast, integrate without friction and deliver financial return from the first month.
100% Software & Cloud
No RFID antennas, beacons or wired sensors on the machines.
Live in 21 Days
Live in 3 weeks with direct technical support and initial calibration.
Zero Integration Friction
Native connection to Navis N4, SAP, local ERPs or Excel/CSV files with no painful migrations.
High-Precision GeoJSON Layers
Accurate terrain modeling with dangerous-goods (IMO) zones, reefers and wind limits.
Offline-First Architecture
Crane tablets keep working even when Wi-Fi/4G drops in the yard.
Proven Payback < 30 Days
The software pays for itself through the crane moves and diesel you stop burning.
Clear answers to technical and operational questions
Full deployment takes exactly 21 days in 4 stages: topographic modeling of the layout in GeoJSON, inventory loading and calibration, What-If testing in the Sandbox Simulator and AI Planner activation with on-site training.
Request a technical assessment of your yard
Send us the dimensions or a test file of your inventory. We prepare a preliminary digital twin to review your terminal's optimization potential together.
- Technical demo on your own layout
- Preliminary reshuffle-reduction estimate
- Reply and session proposal in < 24 hours
Assessment Session with Your Layout
FlowPort's engineering team reviews your terminal data directly to prepare a personalized, no-obligation demo.